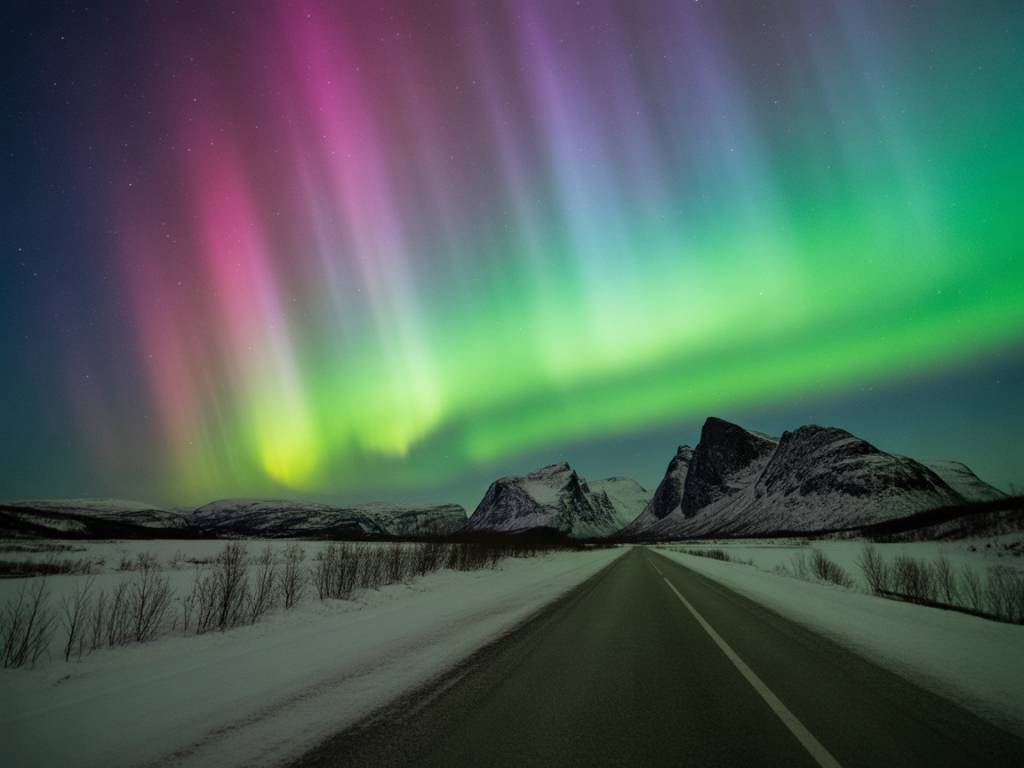
If you’ve ever sat in a rental car at 23:30 on a “KP 6 night”, staring at a fully overcast sky on the wrong side of town, you know that general aurora forecasts are not enough. What you need in that moment is not a KP number. You need to know, very locally: where is the clear sky now, and where will it be in 1–2 hours?
That’s where satellite maps and real-time data really change the game. Used properly, they turn a stressful night into a series of simple, logical decisions: drive here, wait there, give up or push on. In this article I’ll walk you through how I use satellite imagery, short‑term cloud forecasts and live aurora data to build a local northern lights strategy on the ground.
Why KP is not a local forecast
KP and solar wind charts are useful to decide if a night is worth trying. But they do not answer questions like:
- Will the clouds break over Tromsø around midnight?
- Is it worth driving 40 minutes inland from Reykjavík to escape a coastal cloud band?
- Should I stay on the north side of the fjord in Alta, or cross to the south?
Those are local questions. To answer them, you need to add three tools on top of the KP value:
- Real-time satellite cloud images
- Short-term (1–6 h) cloud and precipitation forecasts
- Live auroral oval and solar wind data
Used together, they let you track both the aurora and the sky conditions over the small zone where you actually stand with your tripod.
Key satellite layers you should know
On most weather and satellite sites, you’ll find different “layers”. Here are the ones that matter most for aurora hunters.
Infrared cloud cover: your night-vision for clouds
Infrared (IR) satellite imagery is the workhorse for night-time aurora planning because it doesn’t need sunlight. Instead of showing brightness, it shows cloud-top temperature. High, cold clouds are bright; lower or warmer areas look darker.
Practically, when you look at an IR map over northern Norway or Iceland at night, you’re trying to identify:
- Clear slots: darker zones with no or very thin clouds
- Cloud bands: long, bright stripes moving with the wind
- Edges: the transition zones between cloud and clear sky
In most aurora chases, your best bet is not under perfectly clear skies (they can be far away). The most realistic strategy is to place yourself near the edge of a clearer slot and let the motion of that cloud band work in your favor.
Visible satellite: useful at dusk and dawn
Visible imagery only works with daylight, but it’s still useful in winter when the sun is low but not fully gone. In the afternoon you can:
- Check how much low-level cloud is building over coasts and fjords
- Spot fog forming in valleys and around lakes
- Identify large-scale fronts that will affect the evening
For example, in Finnish Lapland I often look at visible images around 14:00–15:00 to decide if it’s worth staying in town or if I need to drive north toward drier inland air before dark.
Precipitation radar: avoid the hopeless zones
Strictly speaking, radar is not satellite data, but it appears on the same maps in many apps. For aurora hunting, radar is useful for one simple thing: identifying areas of persistent, thick cloud with active precipitation.
If you see a heavy, stationary precipitation band over the coast of Tromsø or the whole south of Iceland, don’t waste your night under it. Use radar to draw a quick “no-go” polygon on your mental map and look for escape routes around it.
Where to get reliable satellite and cloud data
There are many tools out there. The interface matters less than your ability to read the basic patterns. Here are typical categories and what to look for:
- National meteorological services: Local met offices (e.g. Norway, Iceland, Finland, Sweden, Canada) often have the cleanest, least “gimmicky” satellite loops with high resolution over their territory.
- Global weather platforms: Sites and apps that merge satellite + radar + cloud forecasts (for example, those using ECMWF or ICON data) are excellent to visualize the next 1–6 hours with animated maps.
- Specialized aurora tools: Some aurora forecast sites integrate cloud cover odds with KP forecasts. These are a good starting point, but I still recommend checking the raw satellite imagery on top.
Whatever you use, make sure you can:
- Animate the last 2–4 hours of satellite images
- Overlay or compare with cloud cover forecasts for the next few hours
- Zoom in enough to distinguish local valleys, fjords, and coastlines
Combining satellite maps with live aurora data
Satellite maps tell you where the sky is open. You still need to know if there is any auroral activity to look at. For that, I combine three main sources:
- Auroral oval maps (based on current solar wind and magnetosphere data)
- Ground magnetometer data (local disturbances indicating substorms)
- Solar wind streams (speed, density, IMF Bz from ACE/DSCOVR)
Here is how the logic works in practice:
- If oval looks strong over your latitude + satellite shows breaks in cloud nearby → it’s time to move toward the clearest sector.
- If oval is weak or retreating poleward + clouds are moving in → reduce your expectations; maybe stay close to town and aim for a brief, low aurora gap.
- If oval is strong but you’re fully clouded out → look for a realistic driving radius (1–2 h) and use satellite & radar to find a corridor of clearer sky.
The goal is not to become a space weather expert. It’s simply to answer: “Is the sky worth chasing if I can find a clear patch?” Once the answer is yes, most of your effort should go into reading clouds and terrain.
From maps to strategy: planning your night
Let’s go through a typical decision chain you can use in almost any northern lights destination. Think of it as a repeatable method, not a rigid recipe.
Step 1: Define your realistic movement radius
Start with something many people skip: how far can you actually go tonight, safely?
- Are you okay driving 1.5 hours on icy roads, or do you want to stay within 30 minutes of your hotel?
- Are you in a tour group with a fixed turnaround time?
- Do you know the roads, or is this your first time driving in snow?
Your movement radius (often 50–150 km) will define how you read the maps. There’s no point dreaming about a clear window 300 km away if you can’t get there and back before 03:00.
Step 2: Check the big picture first
Before zooming in, look at a regional satellite image covering at least 500–1,000 km around you.
Identify:
- Large weather systems: fronts, big spirals of cloud, huge clear high-pressure cells
- General cloud motion: is it moving from the ocean inland, north to south, west to east?
- Position of the clearest air mass: is the best sky over the interior, over the coast, or further north/south?
This step answers a simple question: Am I starting in the right general area, or am I on the wrong side of the system?
Step 3: Zoom in to your city or region
Now zoom to the scale where you can see individual fjords, valleys, islands, and lakes.
Look closely at:
- Cloud edges: where exactly is the sharp border between overcast and clear?
- Breaks in the deck: narrow darker strips within a cloudy region, often aligned with wind direction
- Orographic effects: clearer leeward sides of mountains, cloud buildup along certain coasts
Try to place your base town (Tromsø, Rovaniemi, Abisko, etc.) within that pattern:
- If your town is under a cloud edge → you might just need to move 20–40 km inland or along the coast.
- If your town is in the middle of a thick cloud mass → you’ll probably need a longer drive, or manage expectations.
Step 4: Add short-term cloud forecasts
Once you know the current pattern, check 1–6 hour cloud forecasts from your preferred weather model (ECMWF, ICON, Arome, etc.). Focus on:
- The movement of dense cloud zones
- The timing of clearing or closing over your town or nearby valleys
- The consistency across different models or apps (if 2–3 models agree, confidence is higher)
This is where you start building an actual plan with time windows. For example:
- “Clouds clearing east of Tromsø between 22:00 and 00:00. Best chance: drive E6 south then E8 east, aim for the inner valleys.”
- “Coastal band over Reykjavík stays all night, but inland to Thingvellir it might open between 01:00 and 03:00 if the northerly wind pushes it south.”
Step 5: Cross-check with aurora activity
Now layer in the space weather:
- Is KP forecast above your typical visibility threshold (around KP 2–3 for polar regions, KP 4–5+ further south)?
- Is Bz (IMF orientation) trending southward, which favors brighter auroras?
- Do local magnetometers show any substorm “spikes” in the last hour?
Match activity windows with your clear-sky windows. If the best auroral activity is more likely early evening and your clear sky is predicted at 02:00, your expectations should be moderate (you might still get a late substorm, but don’t count on a big show).
Step 6: Choose specific, realistic target spots
With all that information, pick 2–3 concrete locations within your driving radius:
- One primary spot where you’ll head first (best compromise of clear sky + safety + scenery)
- One backup spot in a slightly different direction (for example, further inland if coastal clouds grow)
- One fallback close to town (for short gaps in the clouds when conditions are poor)
When choosing these targets on the map, check:
- Road type and winter maintenance (main roads vs tiny mountain tracks)
- Available parking without blocking traffic or private drives
- Orientation of the horizon (a clear view to the north is ideal, but side views also work with overhead auroras)
- Light pollution level (a few distant farm lights are fine; industrial zones are not)
Practical field use: adjusting on the fly
Even with the best plan, the atmosphere will not follow your script. That’s why you should treat your strategy as a dynamic loop:
- Before leaving town: last check of satellite loop (past 2–4 hours) + short-term cloud forecast + aurora data.
- On the road (passenger’s job): monitor new satellite frames every 15–30 minutes and re-evaluate the direction of motion.
- At the spot: if clouds thicken unexpectedly, use live satellite + radar to decide whether to wait 30–60 minutes or switch to backup location.
A simple rule I use: if the satellite loop shows the cloud edge moving over me but not clearing within 1–1.5 hours, I move. If it looks like just a passing band, I wait, even if the sky is fully covered for 20–30 minutes.
Examples from the field
To make this more concrete, here are two typical nights and how satellite data changed the outcome.
Case 1: Coastal trap in Northern Norway
Starting in Tromsø with KP 4 forecast and moderate activity already visible on the oval. Local weather apps said “partly cloudy”. Satellite IR, however, showed a thick coastal band parked over the outer islands, with a sharp edge 40–60 km inland.
Strategy based on satellite:
- Avoid scenic coastal spots that would stay cloudy all night.
- Drive south then east into the inland valleys where the clear slot was holding.
- Park near a known lay-by with a north-facing view at the edge of the cloud line.
Result: over 2 hours of stable, mostly clear sky and multiple substorms, while the coastal areas stayed overcast.
Case 2: Late clearing near Reykjavík
Afternoon visible satellite showed a large, messy low-pressure system over southwest Iceland. IR loop in early evening confirmed: Reykjavík would be under thick cloud until at least midnight. Cloud models suggested a gradual southward shift after 00:00–01:00.
Strategy based on satellite + forecast:
- Skip the classic coastal viewpoints for the first half of the night.
- Plan a late departure inland, aiming for the northern edge of the cloud mass east of the city.
- Use radar to avoid zones with active snow showers, favoring a drier corridor along the main inland road.
Result: the first clear window opened around 01:30. A moderate KP 3 oval produced a decent arc and some pulsating patches for about an hour, enough for solid photos and for guests to tick their “I saw it” box.
Reducing stress and saving energy
The main benefit of using satellite maps and real-time data is not to magically guarantee a show. It’s to reduce “weather stress” and avoid random, exhausting driving.
Instead of second-guessing every cloud that passes above your car, you know:
- Where the clear zones really are, right now
- How fast the cloud edge is moving
- When a gap is just a temporary band or part of a bigger clearing trend
- When your region is simply locked under a hopeless system and it’s time to accept a rest night
This doesn’t kill the magic. It just gives you a simple, rational framework so you can spend less time panicking over apps, and more time actually watching the sky when it finally opens.
If you combine this approach with a basic understanding of KP, Bz and local terrain, you’ll quickly feel the difference: same aurora, same weather, but your nights will feel much more under control—and your odds of standing under a real, dark, starry gap at the right moment will go up sharply.